
RETECHNOLOGY PREMIUM MARKETPLACE RELATED PRODUCTS | WEBINARS | SPECIAL OFFERS


You are viewing our site as an Agent, Switch Your View:
Agent | Broker Reset Filters to Default Back to List
Due to the ongoing situation with Covid-19, we are offering 3 months free on the agent monthly membership with coupon code: COVID-19A
UNLIMITED ACCESS
With an RE Technology membership you'll be able to view as many articles as you like, from any device that has a valid web browser.
Purchase AccountNOT INTERESTED?
RE Technology lets you freely read 5 pieces of content a Month. If you don't want to purchase an account then you'll be able to read new content again once next month rolls around. In the meantime feel free to continue looking around at what type of content we do publish, you'll be able sign up at any time if you later decide you want to be a member.
Browse the siteARE YOU ALREADY A MEMBER?
Sign into your accountState of the Market: A Real Estate Market Report to Send to Clients
December 23 2015
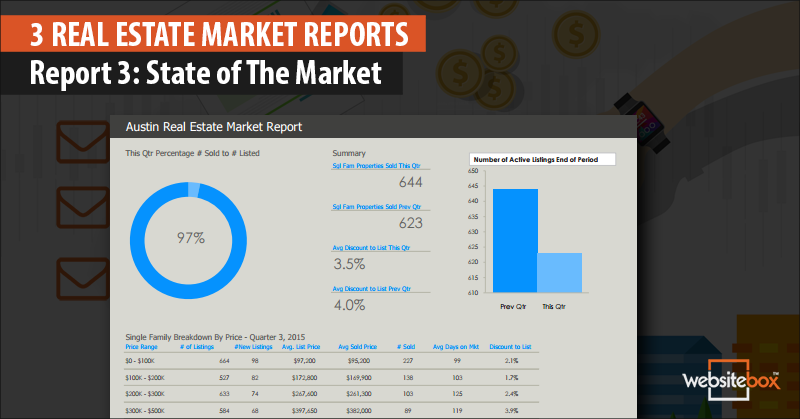 This report is another market snapshot from a quarter-to-quarter comparison perspective. The recently ended quarter is compared to the one before it. This gives the report viewer a view of how the market is moving, which is why we call it 'The State of The Market.' Of course, seasonal fluctuations must be considered as well. Comparing a busy summer quarter with a slower fall quarter requires consideration of the season as a slowing factor.
However, it is good information. Much like our Part 2 report, this one has a graphic overview of consolidated data for the price ranges. We're also doing this for single family, though you could decide to do another one for condominiums.
So, What Data Are We Showing to Compare Quarterly Market Performance?
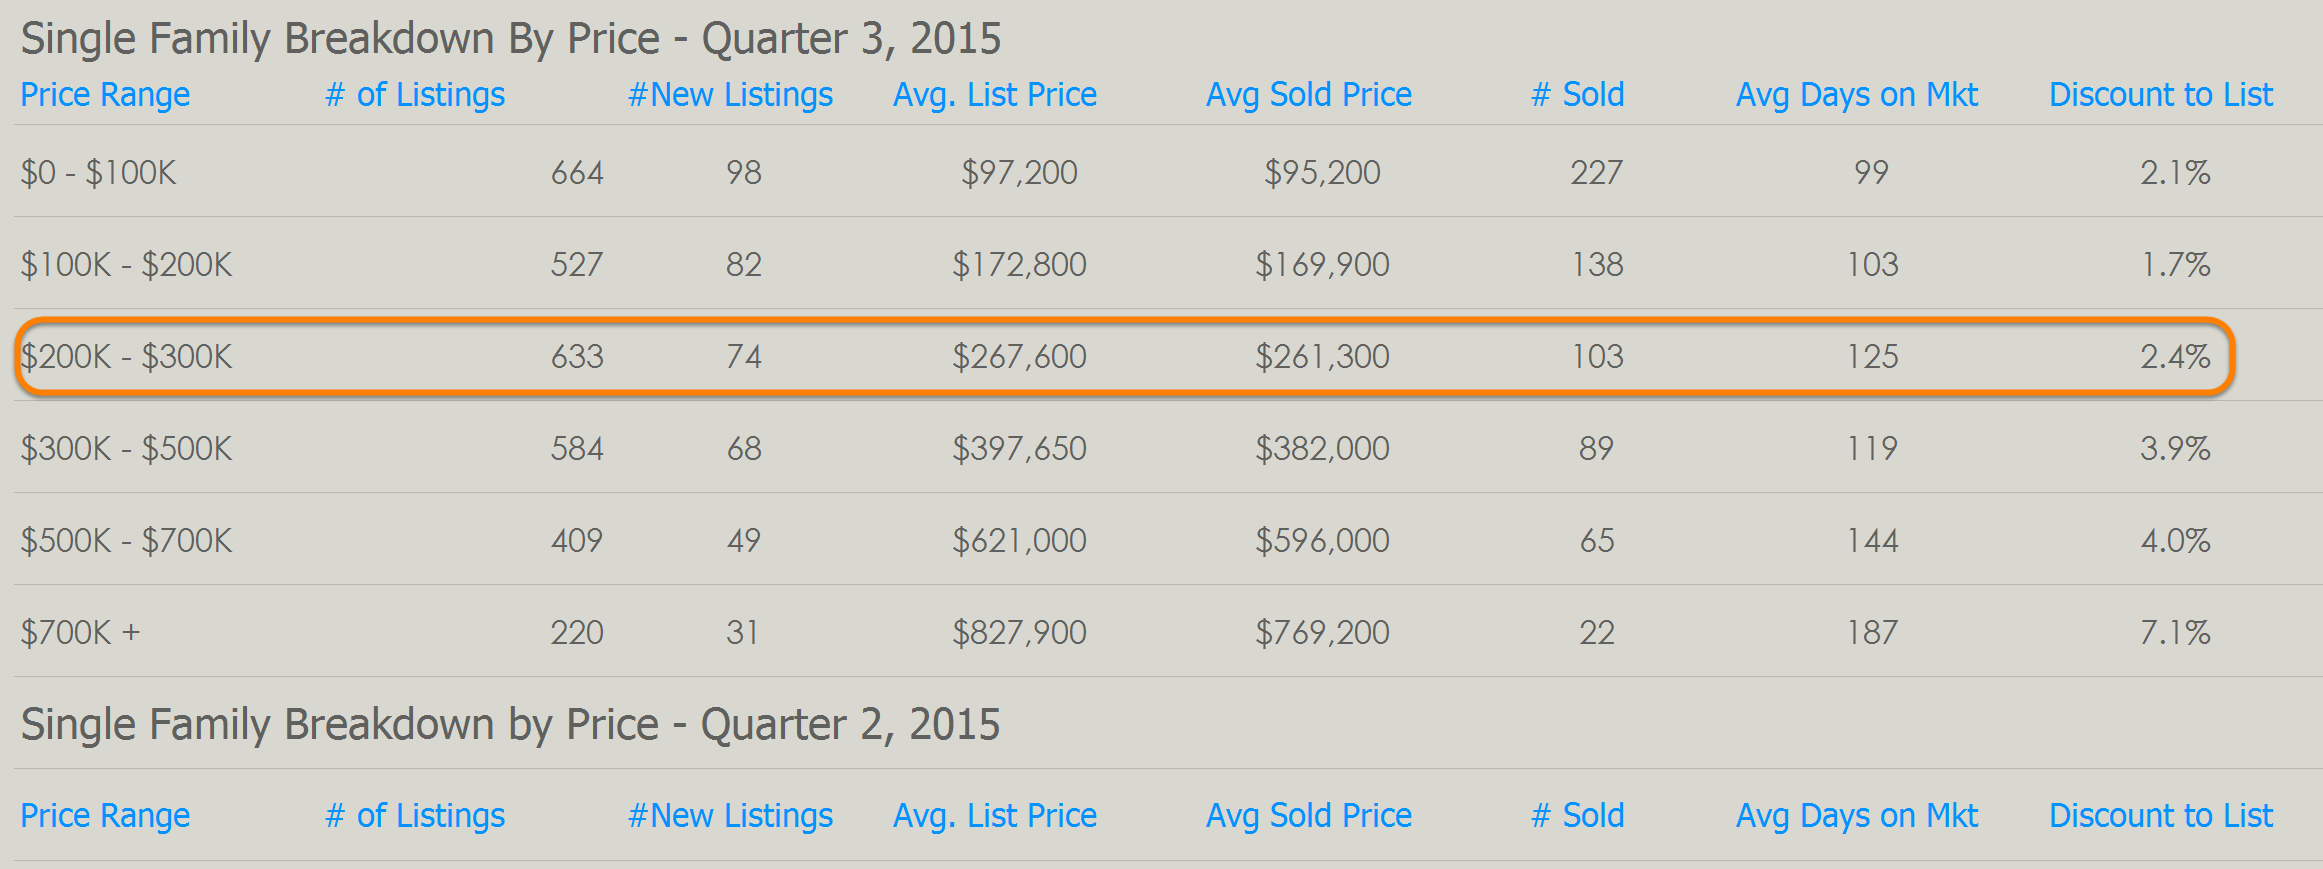
Let's use one line to talk about the columns, the one in the orange box.
Price Range - You decide on how you want to break your report out. Your market may be better displayed with smaller increments of $50,000, rather than the $100,000 shown here. Set them the way you want and pull your data from the MLS by price range.